Use Python and Streamlit to visualise your FPL league’s standings
See the App here: fplwrapped.streamlit.app
This year, to avoid the week in, week out stress of playing Fantasy Premier League, I decided to create a small app to help my friends analyse results in our league, and give a summary of the league so far, similar to a Spotify Wrapped roundup.
To use the app, simply enter your FPL league ID, and the app will display a bunch of information about your league results!
This article will show you how I
- Pulled JSON data from the Fantasy Premier League API
- Used pandas and duckdb to transform the data
- Displayed data to users via Streamlit / Plotly
Querying the API
- FPLDataLoader (Abstract Base Class):
- This serves as the base class for data loading operations.
- It defines abstract methods (
request_data,format_request, andformat_data) that must be implemented by its subclasses.
class FPLDataLoader:
    __metaclass__ = abc.ABCMeta

    def __init__(self):
        self.base_url = "https://fantasy.premierleague.com/api/"
        self.url = None
        self.json = None

    # Convert the variables to attributes
    @property
    def url(self):
        return self._url

    @url.setter
    def url(self, url):
        self._url = url

    @property
    def json(self):
        return self._json

    @json.setter
    def json(self, json):
        self._json = json

    @abc.abstractmethod
    def request_data(self):
        self.json = requests.get(self.url).json()

    @abc.abstractmethod
    def format_request(self) -> str:
        self.data = pd.DataFrame(self.json)

    @abc.abstractmethod
    def format_data(self) -> pd.DataFrame:
        return pd.DataFrame(self.data)

    def get_data(self):
        self.request_data()
        self.format_request()
return self.format_data()- StandingsLoader:
- Inherits from
FPLDataLoader. - Retrieves standings data for a specific league using the FPL API from the following URL: https://fantasy.premierleague.com/api/leagues-classic/{league_id}/standings/
- Formats the data into a Pandas DataFrame, mapping relevant columns.
- Inherits from
class StandingsLoader(FPLDataLoader):

    standings_schema_mapping = {
        "id": "id",
        "event_total": "event_total",
        "player_name": "player_name",
        "rank": "league_rank",
        "last_rank": "last_rank",
        "rank_sort": "rank_sort",
        "total": "standings_total",
        "entry": "entry",
        "entry_name": "entry_name",
    }

    def __init__(self, league_id):
        super().__init__()
        self.league_id = league_id
        self.url = self.base_url + f"leagues-classic/{league_id}/standings/"

    def format_request(self):
        self.data = self.json["standings"]["results"]

    def format_data(self) -> pd.DataFrame:
        df = pd.DataFrame(self.data)
        df = df.rename(columns=self.standings_schema_mapping)
return df- HistoryLoader:
- Inherits from
FPLDataLoader. - Retrieves historical data for a specific FPL team (entry) using the FPL APL from the following URL: https://fantasy.premierleague.com/api/entry/{entry_id}/history/
- Formats the data into a Pandas DataFrame, mapping relevant columns.
- Inherits from
class HistoryLoader(FPLDataLoader):

    history_schema_mapping = {
        "event": "event",
        "points": "event_points",
        "total_points": "total_points",
        "rank": "fpl_event_rank",
        "rank_sort": "fpl_event_rank_sort",
        "overall_rank": "overall_rank",
        "bank": "bank",
        "value": "team_value",
        "event_transfers": "event_transfers",
        "event_transfers_cost": "event_transfers_cost",
        "points_on_bench": "points_on_bench",
        "entry": "entry",
    }

    def __init__(self, entry_id):
        super().__init__()
        self.entry_id = entry_id
        self.url = self.base_url + f"entry/{entry_id}/history/"

    def format_request(self):
        self.data = self.json["current"]

    def format_data(self):
        df = pd.DataFrame(self.data)
        df["entry"] = self.entry_id
        df = df.rename(columns=self.history_schema_mapping)
return df- LeagueHistoryLoader:
- Combines standings and player histories for a league.
- Utilizes
StandingsLoaderandHistoryLoaderto fetch data for all league entries. - Creates a DataFrame containing cumulative points, ranks, transfers, and other relevant information.
[Insert Images here of App and code.]
class LeagueHistoryLoader:
    league_history_schema_mapping = {
        "event": "event",
        "event_points": "event_points",
        "total_points": "cumulative_points",
        "fpl_event_rank": "fpl_event_rank",
        "fpl_event_rank_sort": "fpl_event_rank_sort",
        "overall_rank": "overall_rank",
        "bank": "bank",
        "team_value": "team_value",
        "event_transfers": "event_transfers",
        "event_transfers_cost": "event_transfers_cost",
        "points_on_bench": "points_on_bench",
        "entry": "entry",
        "player_name": "player_name",
        "entry_name": "entry_name",
    }

    def __init__(self, league_id):
        self.league_id = league_id
        self.standings = StandingsLoader(league_id)
        self.standings_df = self.standings.get_data()
        self.entry_ids = self.standings_df["entry"].tolist()
        self.histories = [HistoryLoader(entry_id) for entry_id in self.entry_ids]
        self.history_dfs = [history.get_data() for history in self.histories]

    def get_data(self):
        history_df = pd.concat(self.history_dfs)
        history_df = history_df.merge(self.standings_df, on="entry")
        # filter history_df to only include the keys in league_history_schema_mapping
        history_df = history_df.rename(columns=self.league_history_schema_mapping)
        return history_df
Querying the data
Now that we have our data loaded, let’s ask some questions about the data. To do most of our transformations, we used Duckdb. Duckdb is an in-process database which supports SQL. This makes it super easy for anyone that knows SQL to query any source (CSV, Database, Dataframe etc.)
I created a file called questions.py containing functions.
Each function:
- Passes in a pandas dataframe
- Uses SQL to return some data
- using duckdb.query allows you to refer to dataframes within your SQL
- returns a pandas dataframe
For example, the following function gets the points for each player’s team for every week.
def get_points_by_gameweek(duckdb_df):
    """
    This function returns a DataFrame with the points gained by a specific player and entry by gameweek,
    ordered by the gameweek in ascending order.
    """
    return duckdb.query(
        """
        SELECT
            player_name,
            entry_name,
            event AS gameweek,
            SUM(event_points) OVER (PARTITION BY player_name, entry_name ORDER BY event) AS points
        FROM
            duckdb_df
        ORDER BY
            gameweek ASC
    """
    ).to_df()
This file will do a lot of the transformations needed before we finally visualize the data.
Displaying The Results in a Web App
Now to build an app to visualize the data.
The app will run like so:
- A user is prompted to enter their league ID into a text box and click the run button
- The app will then fetch the data in the background and once the data is loaded, display some graphs to the user.
Usually, creating an interactive web app like this would take quite a lot of boilerplate code, and this is where Streamlit comes in.
Using Streamlit allows us to produce an interactive graph web app with a few simple lines of python code!
In our new file app.py we bring our different components together to finally create a Web App:
First, import LeagueHistoryLoader and our functions from questions.py to load the data.
import streamlit as st
import plotly.express as px
from src.fpl_load import LeagueHistoryLoader
from src.questions import (
    get_points_by_gameweek
)
Next, we are going to Plotly to create a chart that we want to display to the user. Streamlit allows the use of several python graphing library, and we are going to use Plotly. This function creates a line graph from the pandas dataframe returned by the get_points_by_gameweek function we created earlier.
To tell Streamlit to display this graph to the user, you just need to write st.plotly_chart(fig) to display the Plotly graph we’ve created.
def plot_total_points(df):
    fig = px.line(
        df,
        x="gameweek",
        y="points",
        color="entry_name",
        title="Total Points by Gameweek",
    )
    fig.update_xaxes(title_text="Gameweek")
    fig.update_yaxes(title_text="Total Points")
    fig.update_layout(autosize=True, height=800, width=800)  # Add this line
    st.plotly_chart(fig)
Finally, let’s string all of the pieces together. Our main function starts our application, uses some Streamlit specific code to create the text input and button that will allow the user to enter their league ID, and finally display_data() will run our graphing functions created above.
def main():
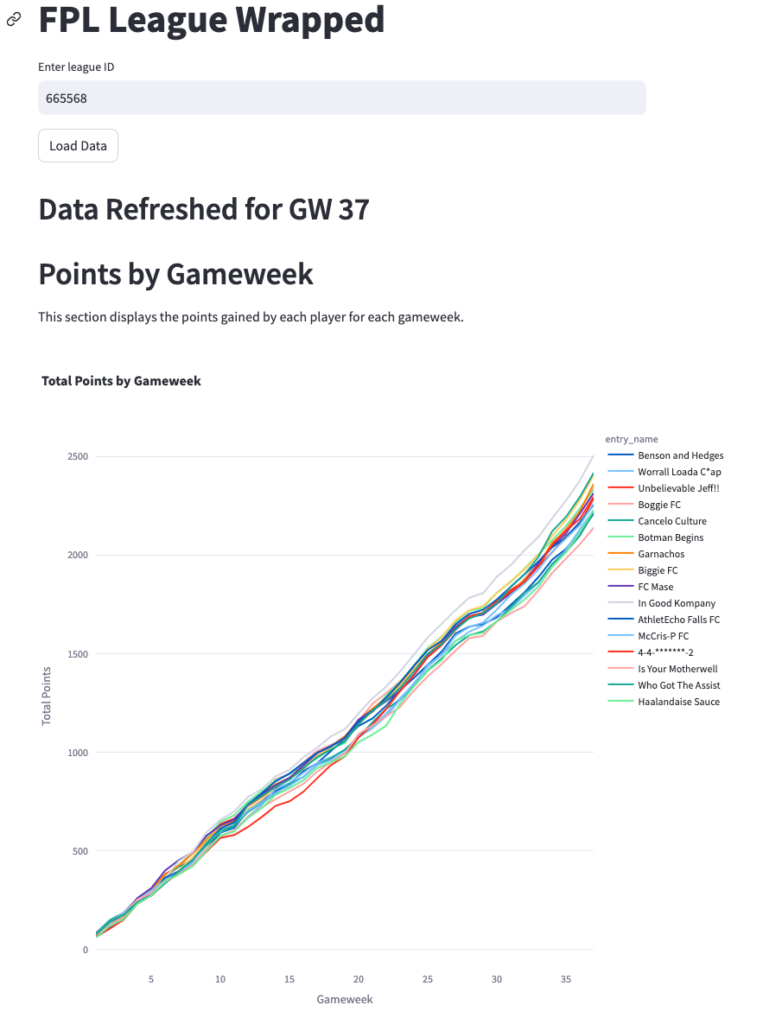
st.title("FPL League Wrapped")
league_id = st.text_input("Enter league ID", "")
load_button = st.button("Load Data")
if load_button:
if not league_id.isdigit():
st.error("Please enter a valid league ID.")
# Initialize LeagueHistoryLoader
league_history_loader = LeagueHistoryLoader(int(league_id))
display_data(league_history_loader)
def display_data(league_history_loader: LeagueHistoryLoader):
# Load League Data
df = league_history_loader.get_data()
# Display the max game week
st.markdown(f"## Data Refreshed for GW {df['event'].max()}")
st.markdown("## Points by Gameweek")
st.markdown(
"This section displays the points gained by each player for each gameweek."
)
points_by_gameweek_df = get_points_by_gameweek(df)
plot_total_points(points_by_gameweek_df)
if __name__ == "__main__":
main()Streamlit Hosting
I used Streamlit Community Cloud to display the app to my friends, which is a really simple setup process. You simply push your code to Github, and point Streamlit to your repo. Alternatively you can self-host the app.
Conclusion and next steps
Creating custom data apps for MVPs used to be a bit of a chore, but Streamlit fits in really well to help us produce something quickly. There are a few reasons why you may not want to use Streamlit for a production app to show to customers, but as a tool to get your data skills out there immediately, it’s brilliant.
I’ll continue to use FPL data as a focus moving forward in this Data Engineering Series.
Next up, I’m going to add a bar chart race to the app.
Thanks for reading!